AirCare
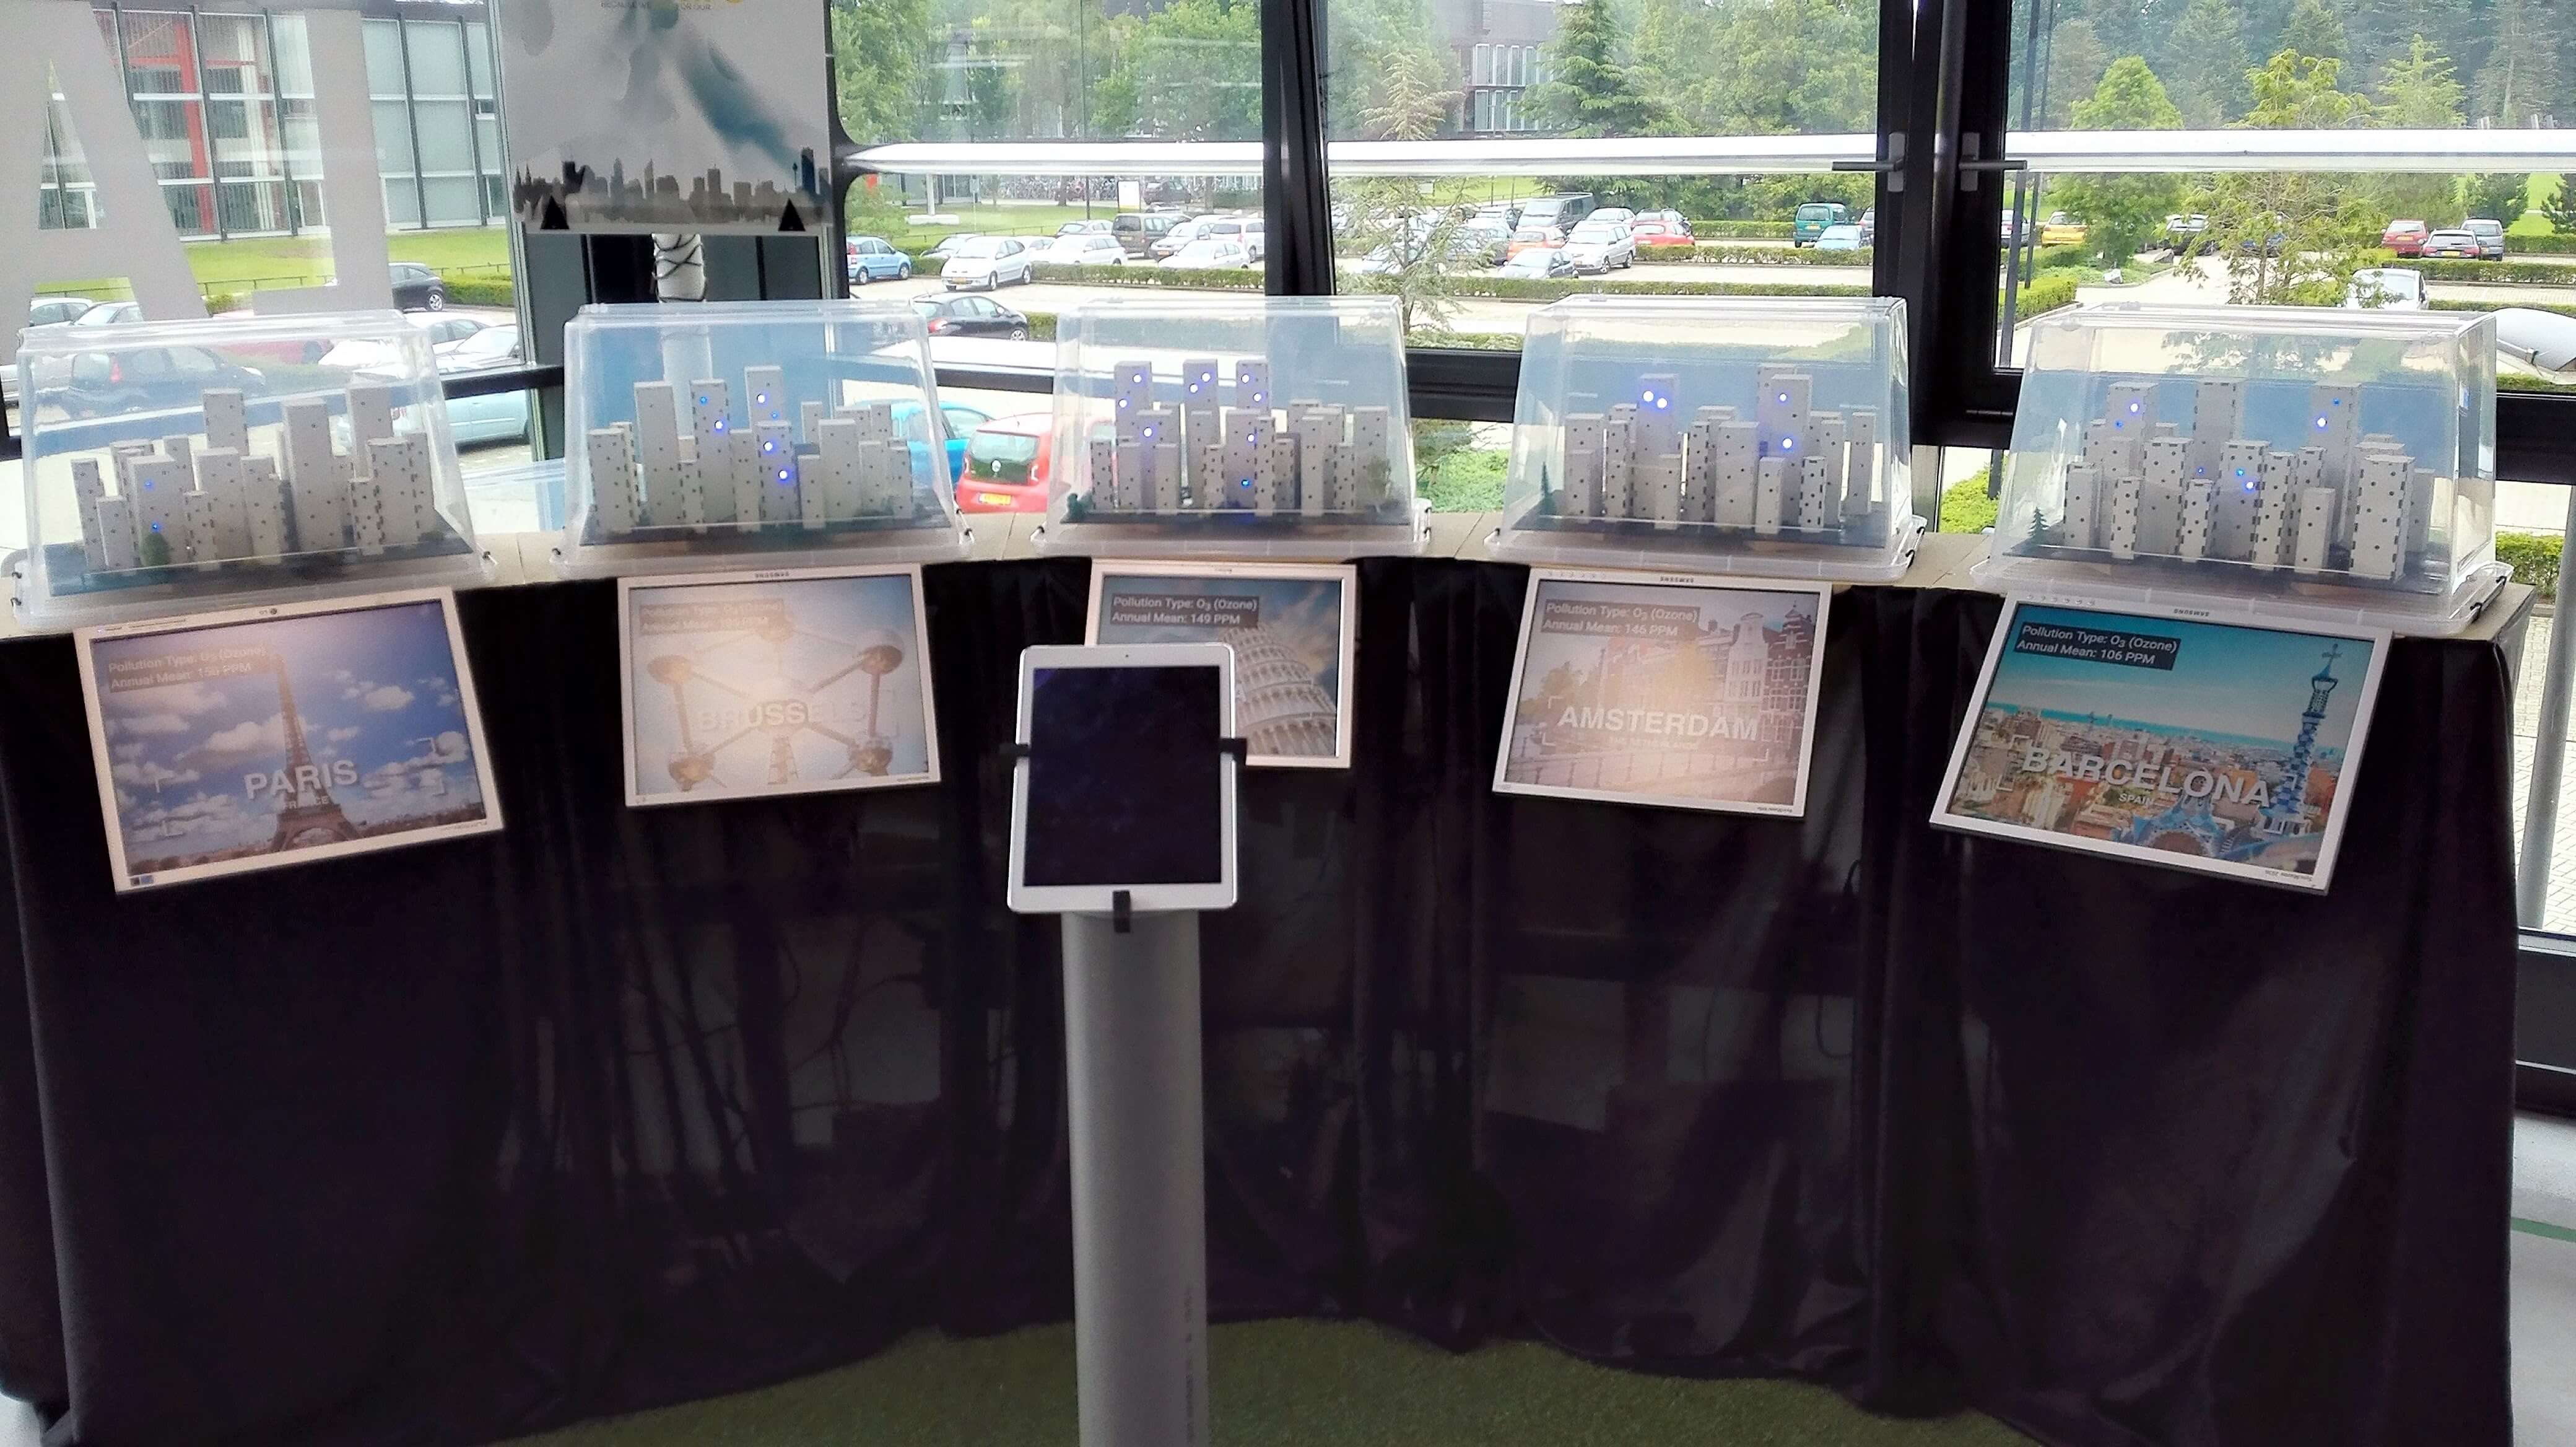
AirCare tells the story of air pollution: which cities are filthy, and which cities are clean. The result might surprise you. The cool thing about this data physicalisation is that pollution actually represents the pollution: The dirtier the air in a city is, the denser the smog in the box representing the city is.

The system
The system is designed to be an eye-opener. It is supposed to make the audience realize how disgusting air pollution in a city can be. The data that is used in the system is collected by the World Health Organization and represents 25 cities and represents 4 different elements of air pollution.
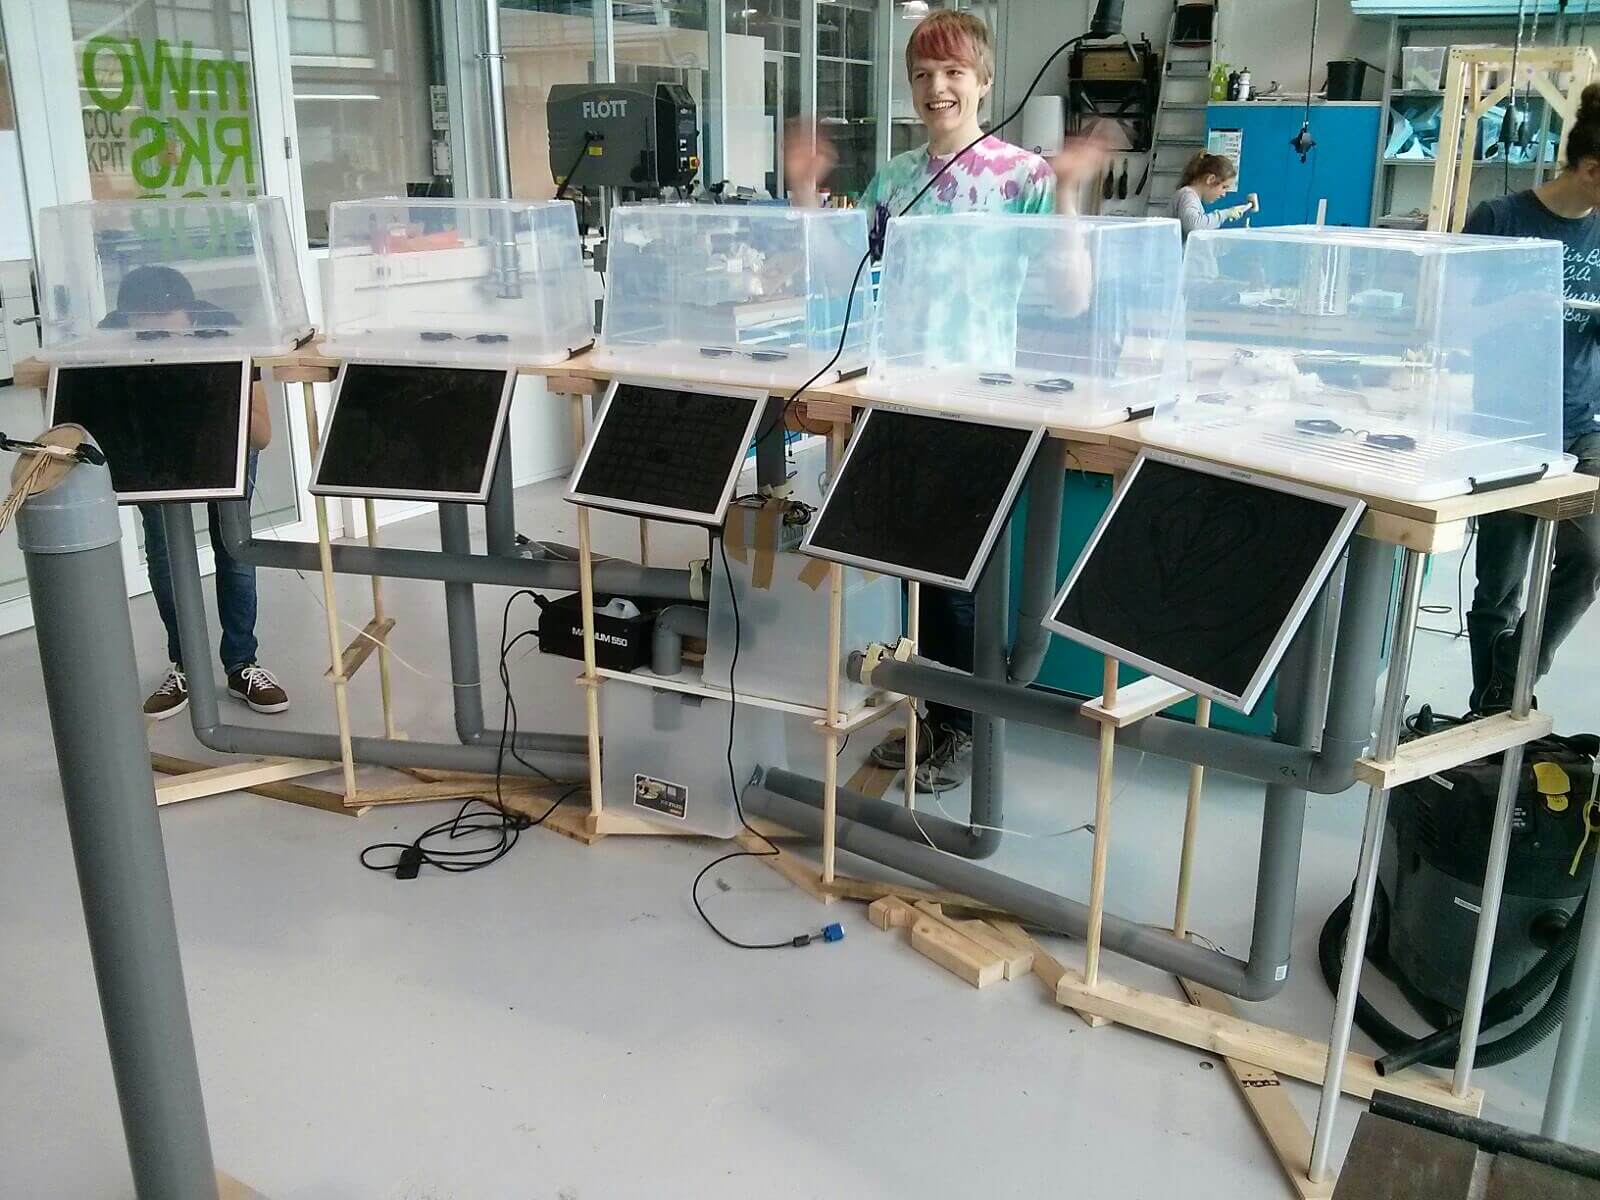
The user can select 5 cities and an air pollution component after which 5 boxes representing each city will fill up with smog while displaying a video giving information about air pollution. In the boxes are models of cities with lights in the windows that are also representing the amount of smog in a city.

My work
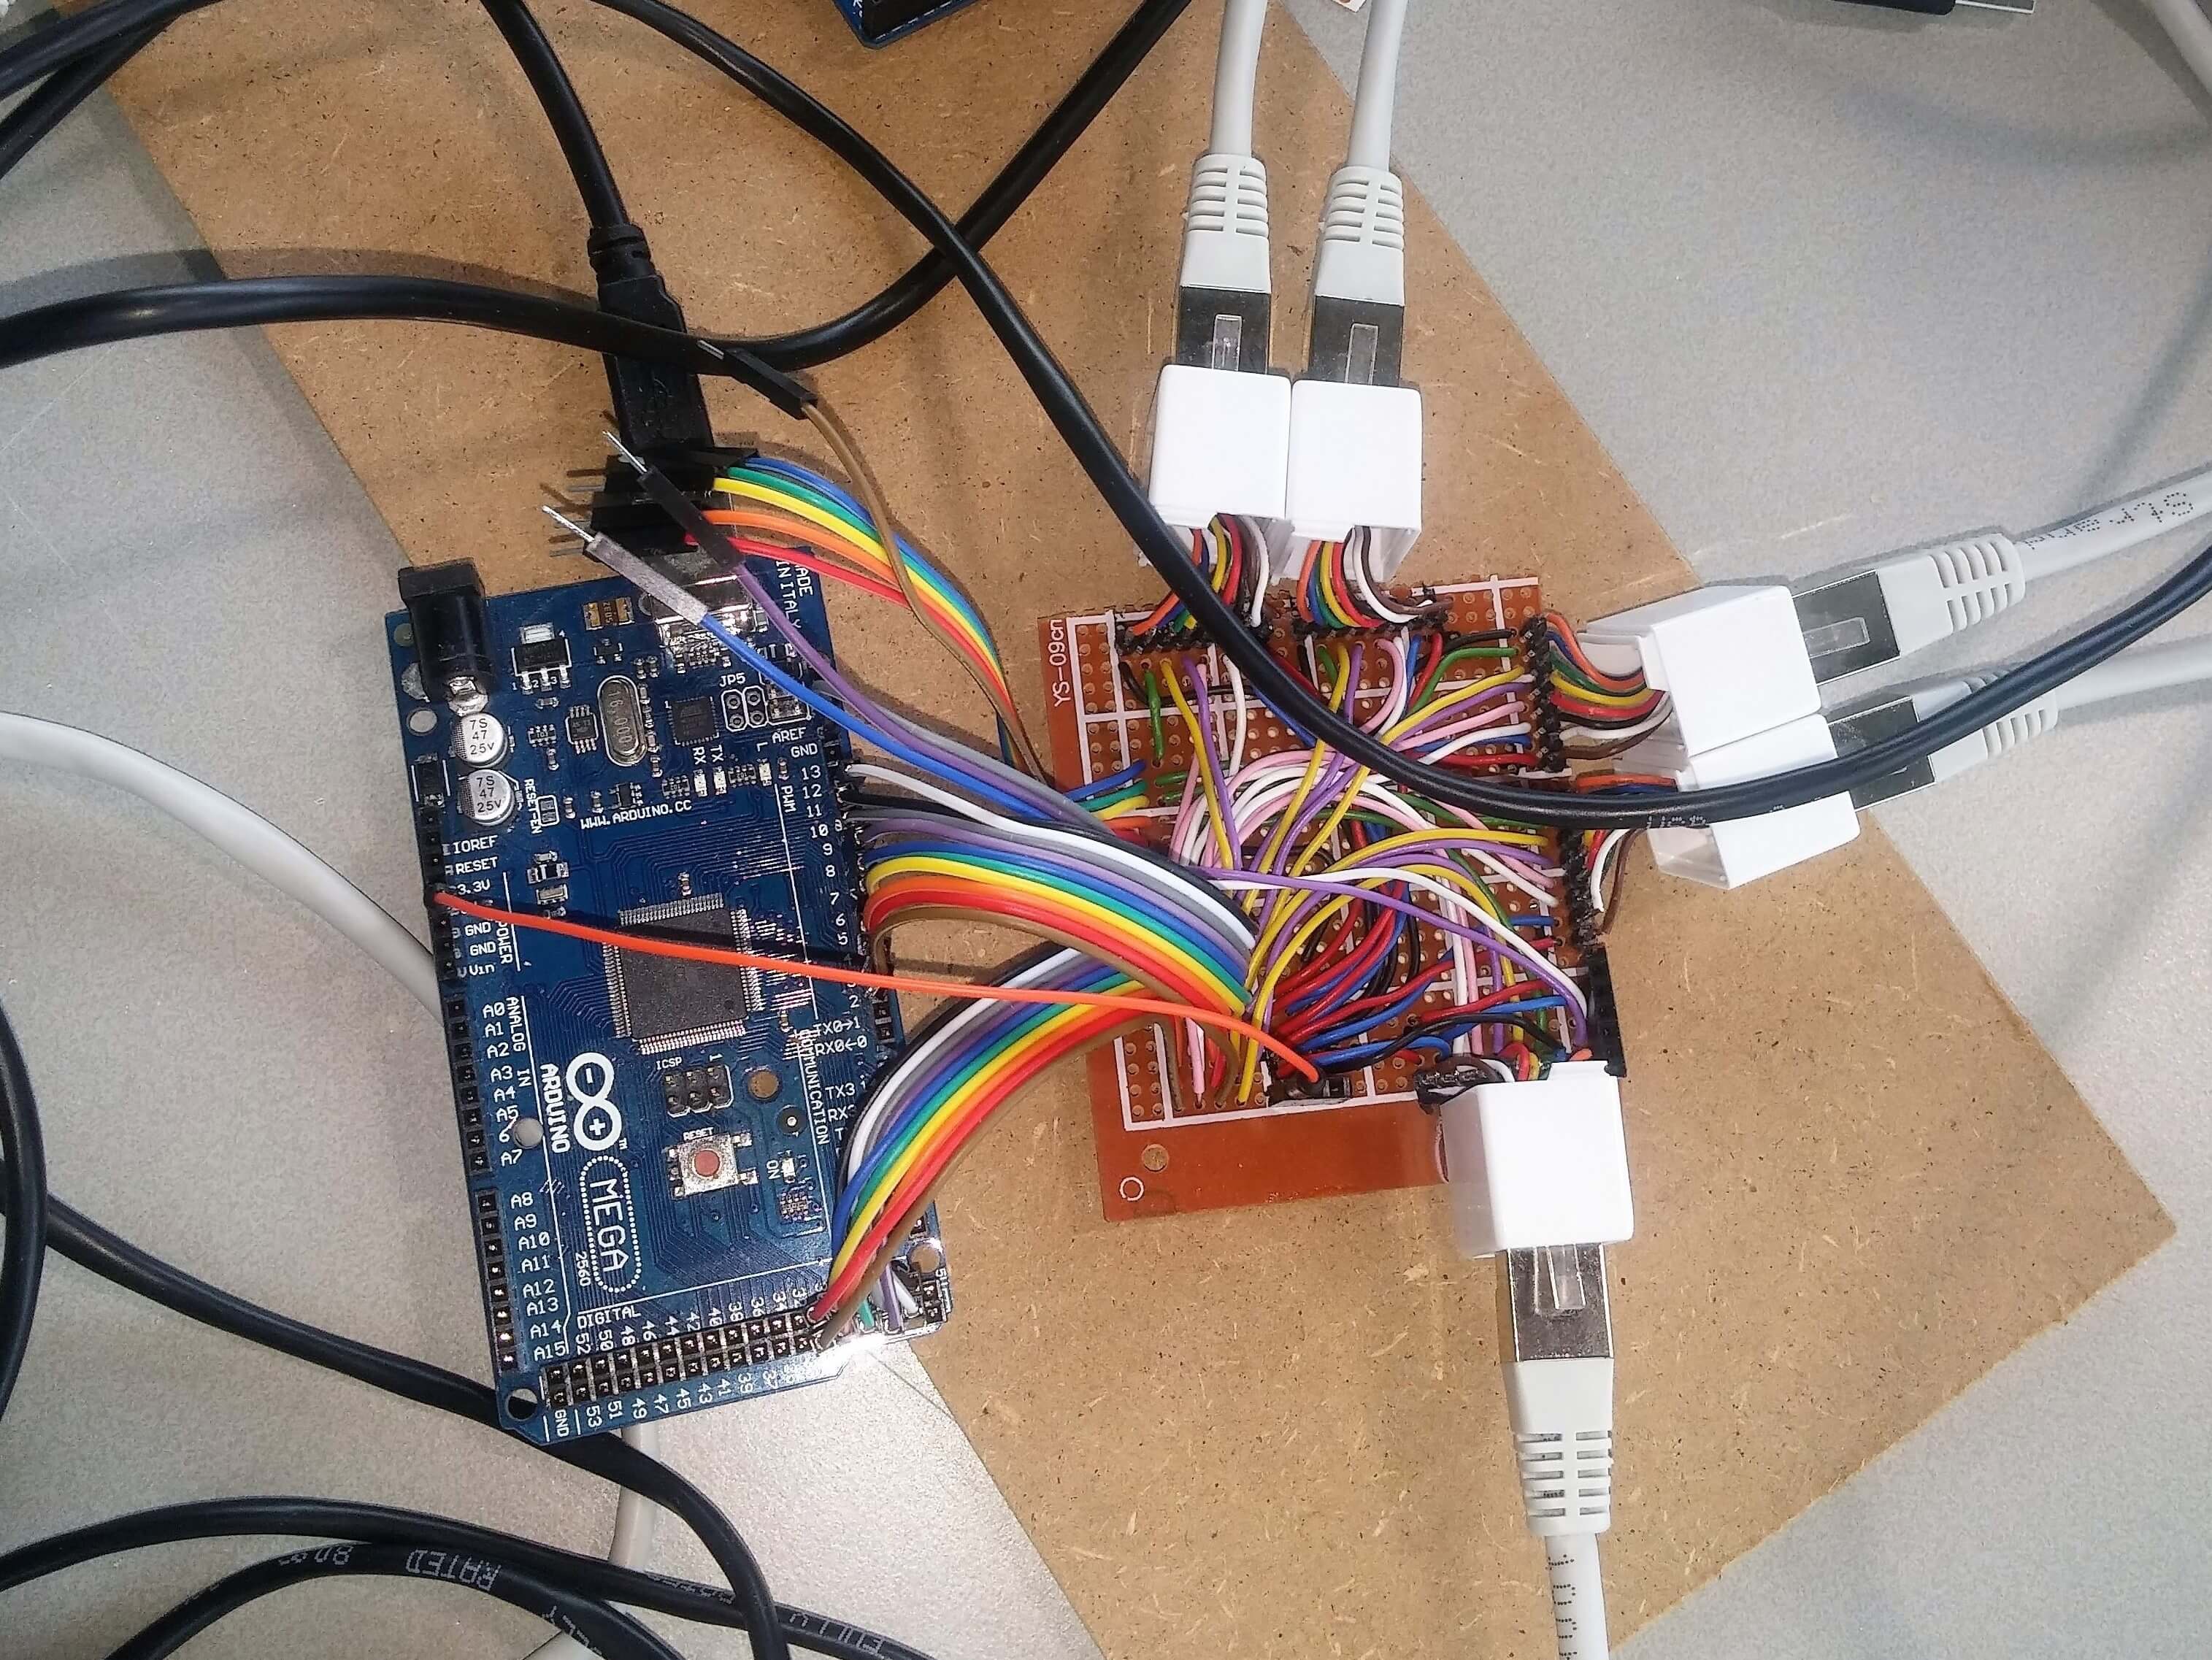
My part in this project was designing the electrical systems together with another group member. We were in charge of writing the controller software and attaching all electrical components. We had designed a motherboard and 5 node modules that connect the microcontrollers to the valves, lights and and fans that are used to fill the boxes with smog and empty them again. The nodes were connected to the motherboard using UTP cables. The motherboard was than connected to an Arduino Mega and an Arduino Uno, which control the smog and the lights respectively.
